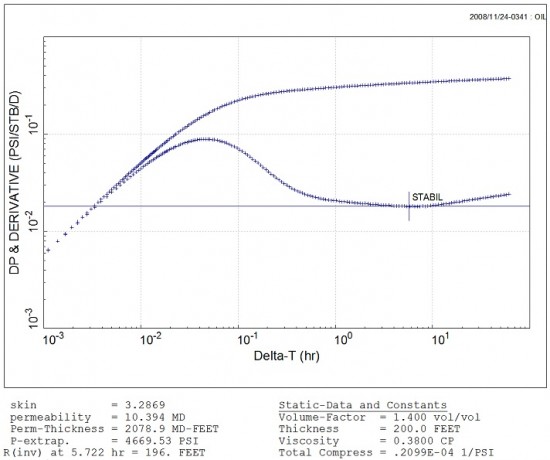
And the main results from this quicklook are permeability, skin and radius of investigation. The P* value can also be derived, provided a suitable rate history.
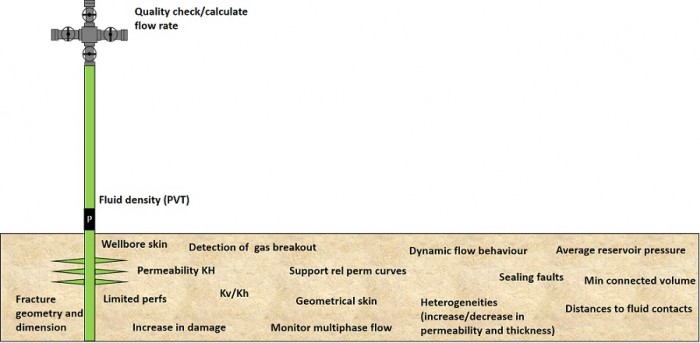
These results are already quite critical since static description from the cores and logs may not be representative of the dynamic flow behaviour and of the reservoir a few meters away from the well. Unlike any other techniques, well test analysis derives information over a large scale of investigation, from hundreds to thousands of meters away from the well.
Sometimes a more complex well test analysis may be missing, with some lost information about heterogeneities in the reservoir (changes in fluid or rock properties), boundaries and proven connected hydrocarbon volumes. Deconvolution may not be used with a lost opportunity to obtain more valuable subsurface information with less.
Well Test Analysis is primarily used for Exploration and Appraisal. However, it can also be applied to production, injection and fractured wells. It is a key tool to understand and visualize the flow behaviour around the wellbore and further away in the reservoir.
Well Test Analysis for production, injection and frac wells
The wellbore pressure and rate data reflect the well and reservoir properties during the life of the well. These properties will change over time with some changes in skin (damage/ degree of communication between the well and reservoir), in effective permeability, in the dynamic flow behaviour around the well, in reservoir pressure, etc… Monitoring these properties with the interpretation of unplanned shutdowns can help detect and diagnose a production problem, and optimize recovery.
Well test analysis is the process of recovering this well and reservoir information over time, by exploring the data using special plots and techniques.
As a result, the operator can turn the production shut-ins into opportunities by using well test analysis.
The figure below summarizes the results from well test analysis.
What a good well test analysis looks like ?
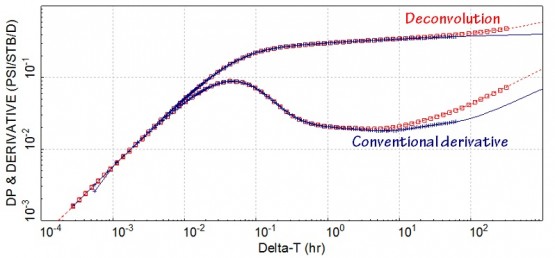
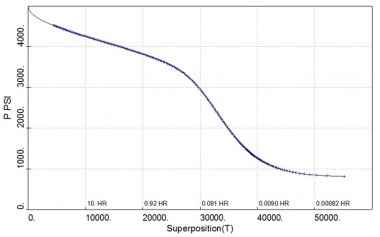
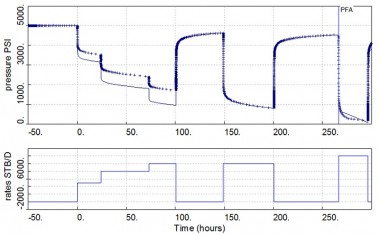
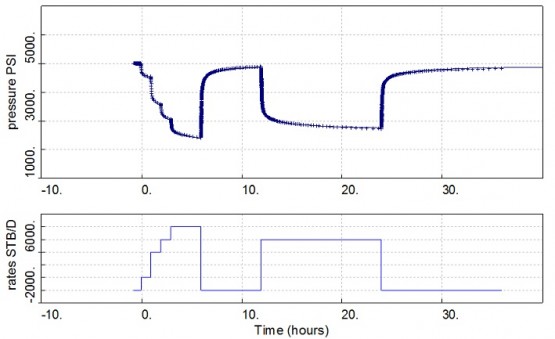
The pressure and rate data are tracked with 4 main plots: conventional derivative, deconvolution, superposition (Horner for the initial PBU), and the production history plots.
Deconvolution and the conventional derivative are used to identify the well and reservoir interpretation models. However, the models need to “realistic” and representative. This means no radial composite model for a geological feature and no horizontal well model for a slightly deviated well.
Once the conventional and deconvolved derivatives are matched, the other plots should also be matched and available in the analysis report.
In the case below, the derivatives are matched with a representative interpretation model.
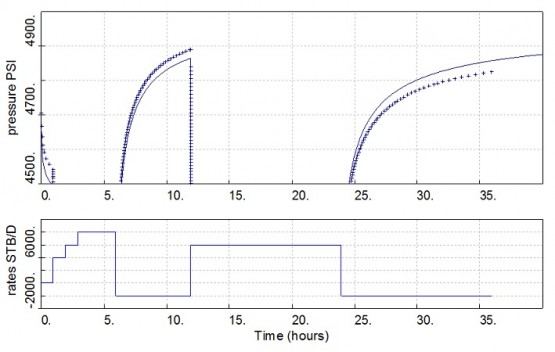
The superposition and production history plots are matched and visible below. When these two plots are not available in a report, then it is likely that well test analysis is not correct.
The most important is to make sure that the PBU tests are matched. If the production periods are not matched, this could be explained by a change in skin/damage.
How good is the match ?
There is no quantitative measure of the quality of a match, this is a subjective judgement. However, efforts should be made to accurately match the pressure data which were measured with high tech quartz gauges, with resolution of 0.01 psi.
Sometimes an analytical model cannot matched the entire dataset, but there should be some good reasons for it. For example, the total compressibility may change with a gas breakout in the reservoir.


Hi every body how about exploration case ?
Hi Hassaim,
Thanks for your comment.
Some exploration wells are also tested, to try to save some cost. We should ensure that the best quality data are acquired to achieve the subsurface objectives. These data should be quality checked, reviewed and the pressure data should be de-tided and “cleaned” from any artifacts. A reliable Deconvolution should be recovered and a full analysis should be performed using the other plots as verification tools. Once multiple solutions are found, then the results should be integrated with the other sources of subsurface information.
MDTs can also be looked at.
We hope this helps,
Best Regards,
The TestWells team
Hello,
May I get good Information regarding Radial composite model and Geological feature ? when should we take radial composite model ?
Hi asmknaik123,
Thanks for your comment.
The radial composite model should be best suited to represent some changes in flowing conditions, created by operators (some examples: a multiphase reservoir region for a well producing below saturation pressure, a flooded region around an injection well, acid-stimulated zone in a carbonate reservoir, etc).
Best Regards,
The TestWells team