Fracture Behaviour
The flow pattern in a fractured vertical well follows different flow regimes over time, as shown below:
-
Initial Fracture Unloading, fracture flow:
At production start-up, we can intuitively imagine that the fluid in the fracture is getting produced first and no fluid from the reservoir is entering the fracture. It could be seen as equivalent to wellbore storage in a vertical well, but with a larger volume.
The flow path indicated in the figure above corresponds to a linear flow inside the fracture; it is therefore called “fracture linear flow”. Since it occurs at very early times, it is generally not seen during a transient response.
-
Contribution of reservoir fluid
As long as the fracture tip has not been reached, the combination of the linear flow in the fracture and in the reservoir gives the following flow pattern:
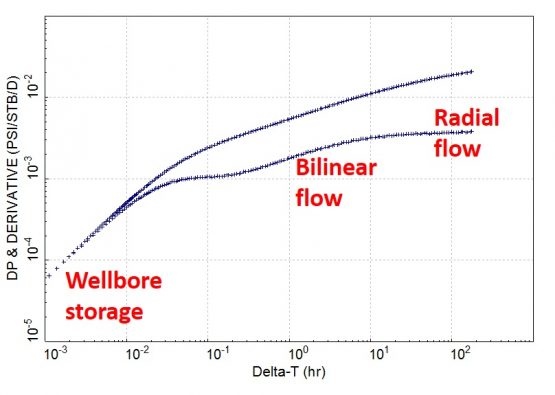
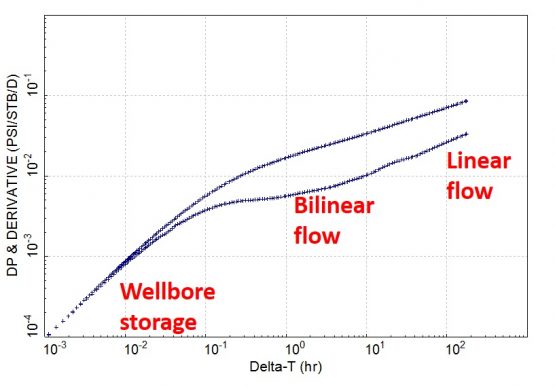
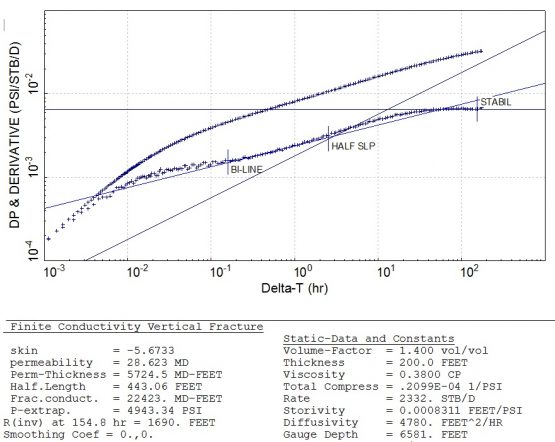
This corresponds to a bi-linear flow regime. The derivative should follow a quarter-unit slope straight-line during this regime.
The bilinear flow regime defines (Kf Wf)/(k Xf), known as the dimensionless fracture conductivity.
(With Kf: the fracture permeability, Wf: the fracture width, Xf: the fracture half-length and k: the reservoir permeability).
If k and Xf are known, then this flow regime provides the fracture conductivity Kf Wf.
-
Reservoir Linear Flow:
In this case, the flow occurs in the direction perpendicular to the fracture plane. The linear flow regime dominates, which is characterized by a half-unit slope straight line in the derivative plot (Δp is proportional to Δt½).
The linear flow regime defines k Xf2. Once the permeability k is calculated from the radial flow stabilization, the fracture half-length Xf can be extracted by identifying the linear flow regime.
-
Radial Flow in the reservoir:
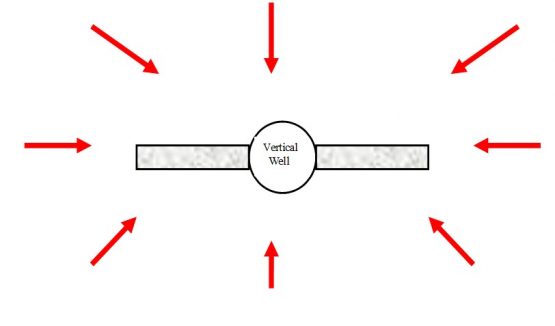
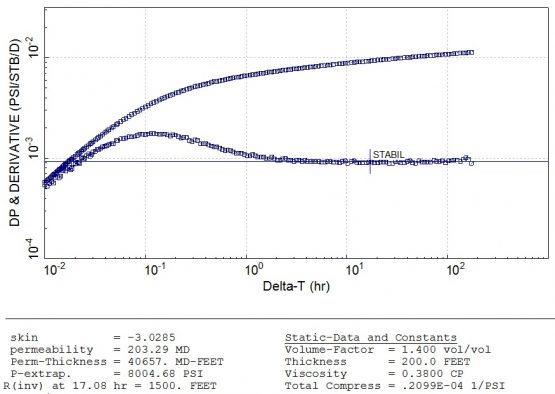
At large distances from the fracture (i.e. at late times), the well acts as a sink point. Radial flow regime develops and the flow lines converge radially towards the well. This is characterized by a derivative stabilization, indicative of the reservoir mobility kh/µ. (with k:formation permeability; h: net reservoir thickness; µ: viscosity of the reservoir fluid).
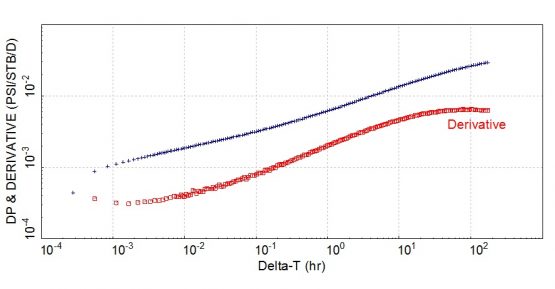
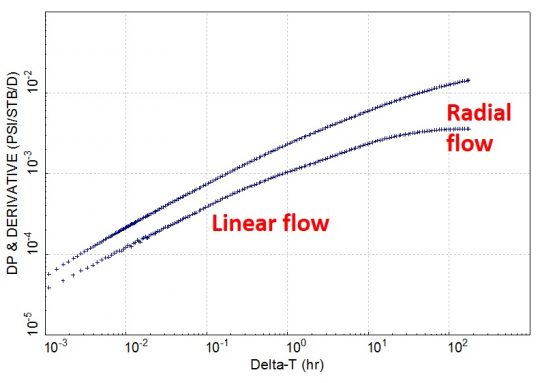
Not only is the derivative plot affected by these different flow regimes, but also the pressure curve. In theory, the Δp plot describes a half-unit slope straight-line for a linear flow regime separated by log(2) from the derivative, and a quarter-unit slope straight-line for a bilinear flow separated by log(4) from the derivative. As a result, the fracture behaviour could also be spot by some parallel lines for the ΔP and derivative plots.
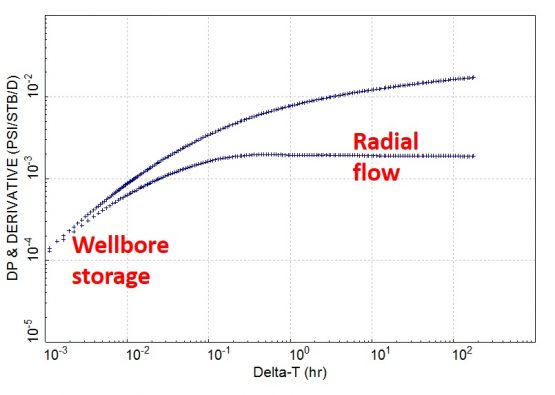
The figure below illustrates the basic derivative response for a fractured vertical well. It is clearly distinctive from a well with wellbore storage and skin.
In practice…
The fracture response may not necessarily follow the characteristics described above, due to wellbore storage effects and damage within or around the fracture. In addition, some flow regimes may overlap or be absent.
As a result, different configurations and types of fracture responses could be possible.
Inspired from “Design and Appraisal of Hydraulic Fractures” by J. Jones and L. Britt- A highly recommended read.
When the pressure gradient along the fracture is negligible compared to the one in the formation (for example with a low reservoir permeability, a large fracture permeability or a small fracture length), the flow in the fracture can be neglected and the bilinear flow regime is not apparent. This defines a high (or infinite) conductivity fracture. On the contrary, when the pressure loss in the fracture is large (high reservoir permeability, low fracture permeability or large fracture length), the linear flow regime may not be present in the sequence described above. The extreme portions of the fracture away from the well do not contribute.
In some extreme cases, the frac signature on the derivative plot may not be apparent, due to some frac damage and very high reservoir permeability (despite a negative skin).
Well Test Interpretation
The most critical step is to identify the radial flow regime outside the fracture, by placing the horizontal stabilization on the derivative. Once this is done, KH and total skin are available.
The identification of the linear flow regime will then define the fracture half-length, and the bilinear flow the fracture conductivity.
If the resulting permeability is high, with lower than expected fracture length and near wellbore boundaries, the radial flow stabilization may not have been correctly selected. The “true” radial flow regime may develop further away from the well, with a higher stabilization at later times on the derivative plot.
The straight line analysis will give some estimates for the frac half-length and conductivity. These can be refined by selecting an interpretation model and matching the data.
What interpretation model to use ?
There are three main hydraulic fracture models:
-
Infinite conductivity fracture:
In this model, the pressure gradient inside the fracture is neglected and there is no flow inside the fracture. Only the reservoir linear flow regime via the half-unit slope straight line is available to define the fracture behaviour. If the horizontal permeability KH is known thanks to the derivative stabilization, then the fracture half-length can be derived from the half-unit slope straight line.
This model is the simplest one since the fracture skin and fracture half-length values are the only parameters to be derived from the fracture behaviour.
-
Partial penetration fracture:
This model involves an infinite conductivity fractured well model over a limited height (less than the net reservoir thickness). After the fracture response, a radial flow regime may develop over the limited fracture height followed by an intermediate flow regime (straight line of negative slope) and finally a radial flow regime over the entire reservoir thickness. This case could be used for water injection wells with thermally-induced fractures, whose vertical extent is generally less than the reservoir thickness.
-
Finite conductivity fracture:
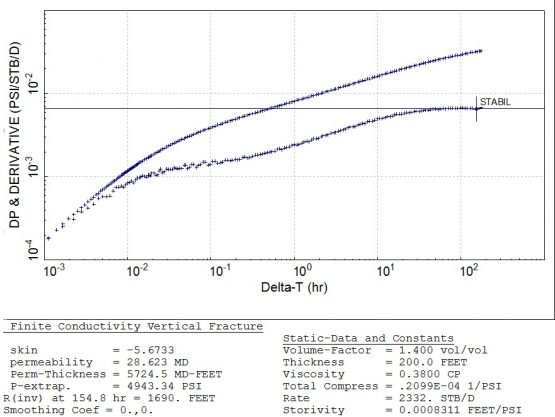
In this model, the pressure gradient and flow inside the fracture are no longer negligible. The bilinear and reservoir linear flow regime are available to define the fracture behaviour. If the horizontal permeability KH is known, then the fracture half-length can be derived from the linear flow regime. Finally the conductivity of the fracture can be obtained from the bilinear flow regime.
In practice, the fracture behaviour may not present all the flow regimes and the fracture parameters may have to be derived by some trials and errors with the non-linear regression algorithm.
There is not much difference between the fractured models but the finite conductivity model may be preferred for a propped fracture in order to derive an estimate of the frac conductivity.
A fracture could also be simply described by a vertical well with wellbore storage and skin. Although the fracture behaviour may not be well modelled, the match during the radial flow regime will result in a total equivalent skin. In a fractured well, the skin will be negative up to -7.
Example: well with hydraulic fracture in a tight gas reservoir
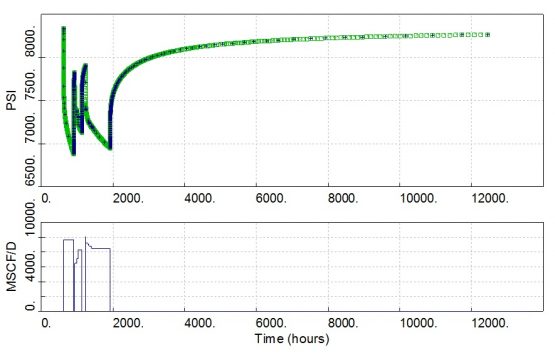
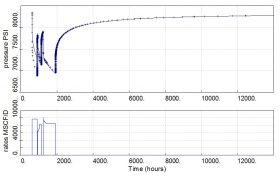
The figure below presents the production data following start-up of a gas well with a hydraulic fracture in a tight gas reservoir.
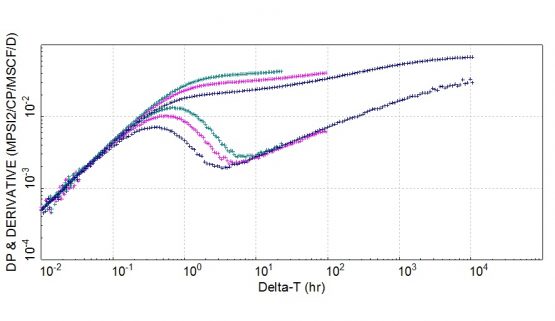
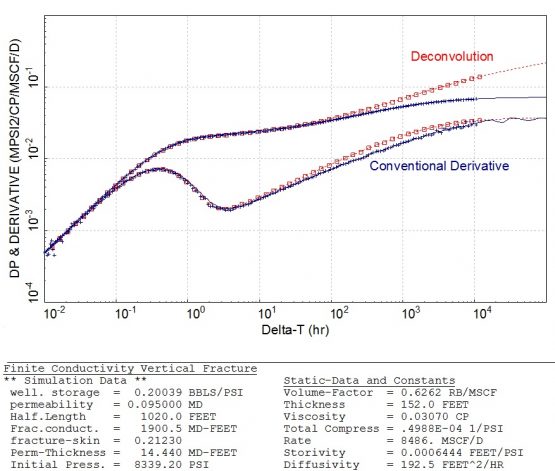
The derivative data are shown in the log-log plot below.
A series of shut-in could help to monitor the fracture clean-up over time. In this particular case, we could note a reduction of the derivative hump at early times and a shift downwards of the ΔP plot. This could mean that the skin is getting reduced over time.
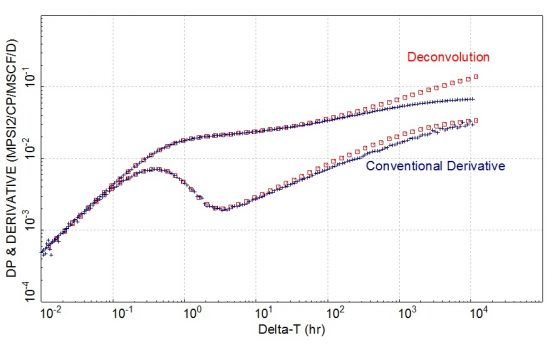
The entire response is dominated by the fracture behaviour. For low permeability reservoirs and large fractures, it takes a very long time (up to some few months) for this regime to develop. In some cases, near wellbore boundaries may prevent the radial flow regime from developing. As a result, the derivative stabilization may never be visible during a test, leading to some uncertainty on the KH value and some complex well test interpretation.
If the reservoir permeability value is not fixed, the fracture dimension won’t be unique. We can reduce this non-uniqueness with different strategies:
-
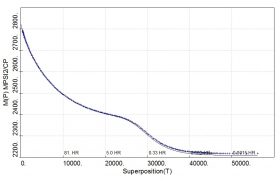
Deconvolution could be investigated to bring more constraints.
-
Trial-and-error in the matching process: we should fix the permeability value and try to match the data and repeat the process with other KH values. The range of results could further be reduced by using alternative fracture evaluation techniques (tiltmeters, microseismic, etc) as constraints.
-
Permeability value may come from a DFIT/ACA injection test before the main frac treatment.
-
The well could be tested before fracturing, in order to obtain an estimate of the formation permeability-thickness KH value.



thank you for this precious post , that s what i m looking for ! i m so glad to join this great group ! thanks everyone contributes by share,comment or any question !!!