Exploration Well YC-1
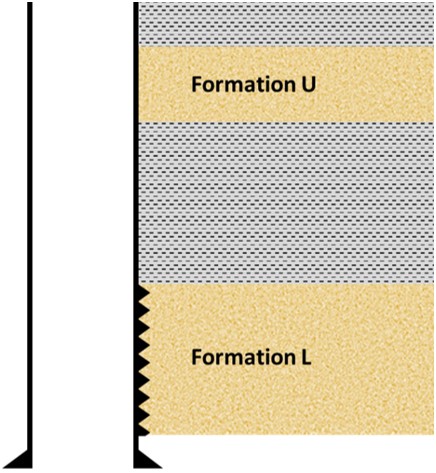
Two sandstone oil reservoir intervals of the vertical YC-1 exploration well, formations L and U, were tested separately during the period from November 8th through November 16th, 2018.
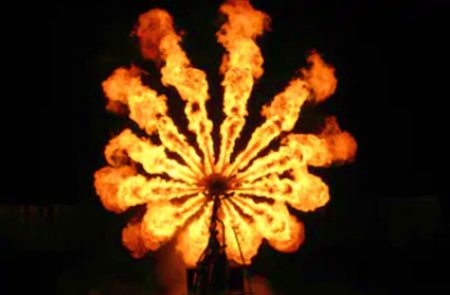
Formation L Well Test (DST 1)
The first drill stem test (DST1) targeted the deeper formation L interval which is separated from formation U by an impermeable layer.
Unfortunately the test had to be terminated sooner than expected due to the production of H2S during the initial clean-up. The well was shut-in for about 12 hours and then killed.
Table 1 shows the PVT and static data for this formation:
————————————–
Fluid Volume-Factor :1.3000 vol/vol
Fluid Viscosity :0.600E+00 CP
Fluid Compressibility :0.600E-05 1/PSI
Water Compressibility :0.300E-05 1/PSI
Porosity :22.3000 %
Water Saturation :20.0000 %
Net Thickness :150.000 FEET
Rock Compressibility :0.300E-05 1/PSI
Wellbore Radius :0.354E+00 FEET
Total Compressibility :0.8400E-05 1/PSI
—————————————
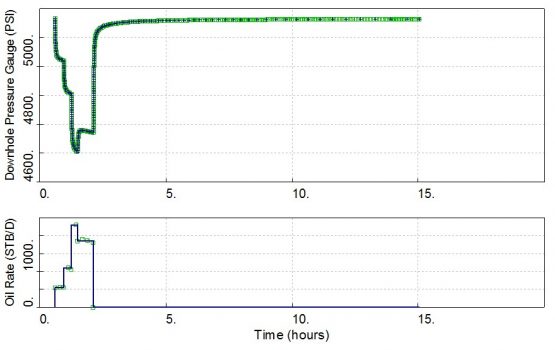
The DST1 test sequence is shown below:
(click on the plot to enlarge it)
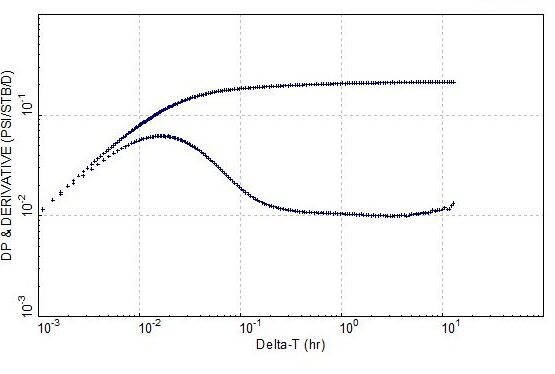
The figure below shows the derivative of the PBU test.
Time limit: 0
Quiz-summary
0 of 8 questions completed
Questions:
- 1
- 2
- 3
- 4
- 5
- 6
- 7
- 8
Information
get ready
You have already completed the quiz before. Hence you can not start it again.
Quiz is loading...
You must sign in or sign up to start the quiz.
You have to finish following quiz, to start this quiz:
Results
Time has elapsed
You have reached 0 of 0 points, (0)
Categories
-
Not categorized
0%
-
- 1
- 2
- 3
- 4
- 5
- 6
- 7
- 8
-
Answered
-
Review
-
Question 1 of 8
1. Question
What well and reservoir models could we identify from this log-log plot? (multiple choice)
-
-
-
-
Correct
-Vertical well with wellbore storage and skin in a homogeneous reservoir with a sealing fault.
-Vertical well with wellbore storage and skin in a heterogeneous reservoir of infinite extent.
Incorrect
-
Question 2 of 8
2. Question
Based on the static data in table 1, what is the permeability value and radius of investigation?
hint:

with Rinv: the radius of investigation in feet, K: the permeability in mD, ϕ: the porosity, µ: the viscosity in cp, Ct: the total compressibility in 1/psi and ∆t: the elapsed time in hours.
-
-
-
-
Correct
KH= 5,506.8 mD.ft, K= 36.7mD
Rinv ~ 409 ft
Incorrect
As mentioned by Earlougher, R.C in the SPE monograph “Advances in Well Test Analysis” and Lee, J. in the “Well Testing” SPE textbook, the radius of investigation only applies to the infinite-acting radial flow case. With presence of boundaries/heterogeneities, the formula will not give a correct value. This is also consistent with SPE 102483 “The Use of Well Testing for Evaluation of Connected Reservoir Volume” by Michael Levitan, Mike Ward, Jean-Luc Boutaud de la Combe and Mike Wilson.
-
Question 3 of 8
3. Question
Could we use Deconvolution to improve our model identification?
-
-
-
-
Correct
We need to use at least 2 PBU tests to refine the initial pressure and recover a reliable deconvolution response.
Incorrect
A few change in initial pressure could affect the shape of the Deconvolution response, in particular at late times. This is why it is recommended to use at least 2 PBU tests to refine the initial pressure and ensure the validity of the Deconvolution response.
-
Question 4 of 8
4. Question
What are two methods that we could use to obtain a minimum connected volume for DST1? Use one of these two methods to calculate a minimum connected oil volume at surface. (hint: bbl =ft³ x 0.17811 and ft³ =m³ x 35.31)
-
-
-
-
Correct
Closing the interpretation model using the conventional derivative or using the radius of investigation for a low side of the range. Vmin= 1.9 mm stb of oil at surface
Incorrect
-
Question 5 of 8
5. Question
We obtained a “P-star”: P* = 5,165.8 psi when using the radial flow straight line on the Superposition plot.

Could we use the P* value as the initial pressure for this analysis?
-
-
Correct
P* = Pi with an infinite acting reservoir. In this case, the late-time increase in the derivative suggests the presence of a boundary.
Incorrect
P* = Pi with an infinite acting reservoir. In this case, the late-time increase in the derivative suggests the presence of a boundary.
-
Question 6 of 8
6. Question
The plots below show the well test analysis and calculated parameters using a vertical well model in a closed homogeneous reservoir.
Derivative plot

Production History Plot

Do you agree with the PBU analysis above?
-
-
-
-
Correct
Incorrect
-
Question 7 of 8
7. Question
In the production history plot above, the model doesn’t match the first two drawdown periods. What could this discrepancy suggest?
-
-
-
-
Correct
Incorrect
-
Question 8 of 8
8. Question
What would be the next steps in the well test analysis workflow (multiple choice)?
-
-
-
-
Correct
Incorrect
Quiz-summary
0 of 8 questions completed
Questions:
- 1
- 2
- 3
- 4
- 5
- 6
- 7
- 8
Information
get ready
You have already completed the quiz before. Hence you can not start it again.
Quiz is loading...
You must sign in or sign up to start the quiz.
You have to finish following quiz, to start this quiz:
Results
Time has elapsed
You have reached 0 of 0 points, (0)
Categories
- Not categorized 0%
- 1
- 2
- 3
- 4
- 5
- 6
- 7
- 8
- Answered
- Review
-
Question 1 of 8
1. Question
What well and reservoir models could we identify from this log-log plot? (multiple choice)
Correct
-Vertical well with wellbore storage and skin in a homogeneous reservoir with a sealing fault.
-Vertical well with wellbore storage and skin in a heterogeneous reservoir of infinite extent.Incorrect
-
Question 2 of 8
2. Question
Based on the static data in table 1, what is the permeability value and radius of investigation?
hint:

with Rinv: the radius of investigation in feet, K: the permeability in mD, ϕ: the porosity, µ: the viscosity in cp, Ct: the total compressibility in 1/psi and ∆t: the elapsed time in hours.
Correct
KH= 5,506.8 mD.ft, K= 36.7mD
Rinv ~ 409 ftIncorrect
As mentioned by Earlougher, R.C in the SPE monograph “Advances in Well Test Analysis” and Lee, J. in the “Well Testing” SPE textbook, the radius of investigation only applies to the infinite-acting radial flow case. With presence of boundaries/heterogeneities, the formula will not give a correct value. This is also consistent with SPE 102483 “The Use of Well Testing for Evaluation of Connected Reservoir Volume” by Michael Levitan, Mike Ward, Jean-Luc Boutaud de la Combe and Mike Wilson.
-
Question 3 of 8
3. Question
Could we use Deconvolution to improve our model identification?
Correct
We need to use at least 2 PBU tests to refine the initial pressure and recover a reliable deconvolution response.
Incorrect
A few change in initial pressure could affect the shape of the Deconvolution response, in particular at late times. This is why it is recommended to use at least 2 PBU tests to refine the initial pressure and ensure the validity of the Deconvolution response.
-
Question 4 of 8
4. Question
What are two methods that we could use to obtain a minimum connected volume for DST1? Use one of these two methods to calculate a minimum connected oil volume at surface. (hint: bbl =ft³ x 0.17811 and ft³ =m³ x 35.31)
Correct
Closing the interpretation model using the conventional derivative or using the radius of investigation for a low side of the range. Vmin= 1.9 mm stb of oil at surface
Incorrect
-
Question 5 of 8
5. Question
We obtained a “P-star”: P* = 5,165.8 psi when using the radial flow straight line on the Superposition plot.

Could we use the P* value as the initial pressure for this analysis?
Correct
P* = Pi with an infinite acting reservoir. In this case, the late-time increase in the derivative suggests the presence of a boundary.
Incorrect
P* = Pi with an infinite acting reservoir. In this case, the late-time increase in the derivative suggests the presence of a boundary.
-
Question 6 of 8
6. Question
The plots below show the well test analysis and calculated parameters using a vertical well model in a closed homogeneous reservoir.
Derivative plot

Production History Plot

Do you agree with the PBU analysis above?
Correct
Incorrect
-
Question 7 of 8
7. Question
In the production history plot above, the model doesn’t match the first two drawdown periods. What could this discrepancy suggest?
Correct
Incorrect
-
Question 8 of 8
8. Question
What would be the next steps in the well test analysis workflow (multiple choice)?
Correct
Incorrect
Formation U Well Test (DST 2)
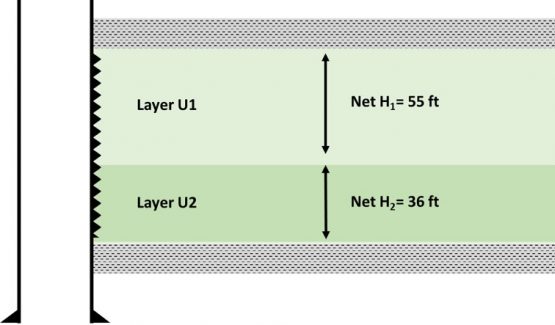
After isolating the formation L, the operations proceeded to only test the formation U. The second drill stem test targeted formation U and its two layers U1 and U2. A Distributed Temperature Array was available inside the tubing-conveyed perforating TCP guns so as to measure the temperature profile along the two layers.
The objectives of DST 2 were to determine the formation KH and skin factor, obtain some samples of the reservoir fluid at reservoir conditions and prove a connected volume of 10 million barrels of oil at surface.
Table 2 shows the PVT and static data for formation U:
————————————–
Fluid Volume-Factor :1.3000 vol/vol
Fluid Viscosity :0.600E+00 CP
Fluid Compressibility :0.600E-05 1/PSI
Water Compressibility :0.300E-05 1/PSI
Porosity :22.3000 %
Water Saturation :20.0000 %
Net Thickness :150.000 FEET
Rock Compressibility :0.300E-05 1/PSI
Wellbore Radius :0.354E+00 FEET
Total Compressibility :0.8400E-05 1/PSI
—————————————
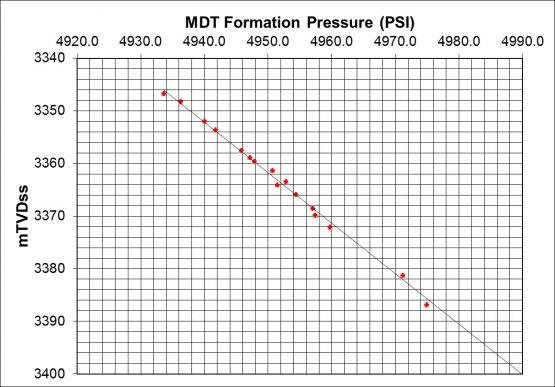
The MDT pressure correlation for the Formation U interval of YC-1 well is presented below.
Below the downhole shut-in tool, the DST string included some downhole samplers and two gauge carriers at 3,315.5 mTVDss and 3,335.7 mTVDss, with four wireless pressure gauges per carrier. Oil rates were measured with a Vortex meter, gas rates with an orifice plate at the test separator.
Both layers U1 and U2 were perforated and tested together.
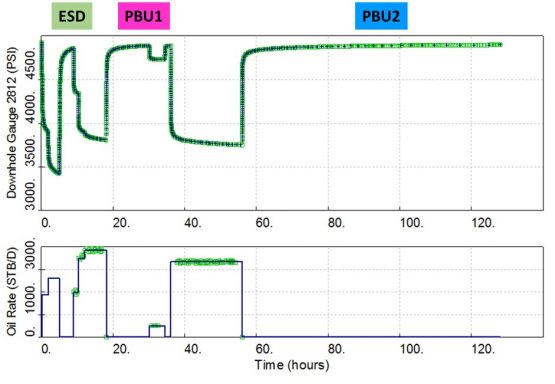
The pressure data for the test sequence as recorded by the downhole gauge 2812 is shown in the figure below. (click on the plot to enlarge it)
The clean-up flow was interrupted by an Emergency Shut Down (ESD) at surface. Once the clean-up was complete, the well was shut-in at the downhole tester valve for PBU 1. This was followed by a fluid sampling flow and a main flow period. The well was then shut-in downhole for the final PBU 2.
No rate measurement was performed before the ESD and the choke model was used to estimate the oil rate during that period. During the test, the GOR increased from 650-680 to 1040 scf/bbl. According to the crew, the well could have produced below bubble point pressure. However, a single phase oil analysis was attempted in the section below.
No production of H2S was observed.
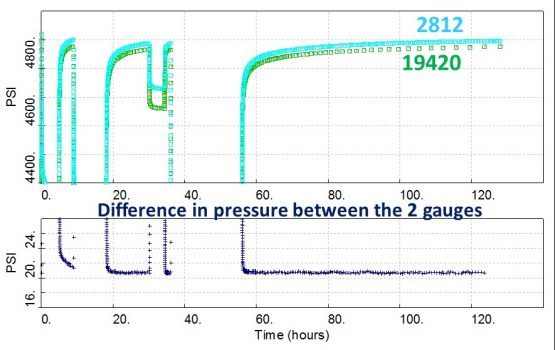
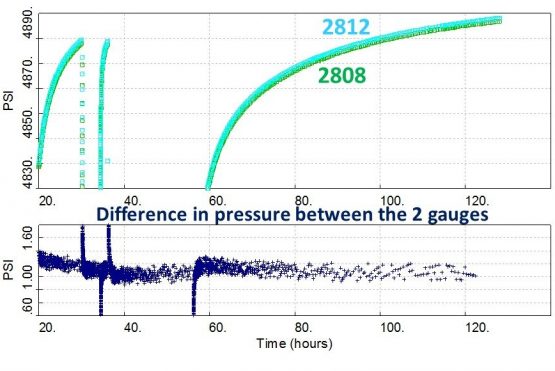
The plots below show a comparison study between gauge 19420 (carrier at 3,315.5 mTVDss), gauge 2808 (carrier at 3,335.7 mTVDss) and gauge 2812 (carrier at 3,335.7 mTVDss).
Time limit: 0
Quiz-summary
0 of 15 questions completed
Questions:
- 1
- 2
- 3
- 4
- 5
- 6
- 7
- 8
- 9
- 10
- 11
- 12
- 13
- 14
- 15
Information
get ready
You have already completed the quiz before. Hence you can not start it again.
Quiz is loading...
You must sign in or sign up to start the quiz.
You have to finish following quiz, to start this quiz:
Results
Time has elapsed
You have reached 0 of 0 points, (0)
Categories
-
Not categorized
0%
-
- 1
- 2
- 3
- 4
- 5
- 6
- 7
- 8
- 9
- 10
- 11
- 12
- 13
- 14
- 15
-
Answered
-
Review
-
Question 1 of 15
1. Question
Why did the team install multiple gauges in the tubing? (multiple choice)
-
-
-
-
Correct
P* = Pi with an infinite acting reservoir. In this case, the late-time increase in the derivative suggests the presence of a boundary.
Incorrect
P* = Pi with an infinite acting reservoir. In this case, the late-time increase in the derivative suggests the presence of a boundary.
-
Question 2 of 15
2. Question
Could we extract some information about the fluid density between the gauges?
-
-
-
-
Correct
Incorrect
-
Question 3 of 15
3. Question
Which gauge would you select for well test analysis?
-
-
-
Correct
Incorrect
2808 seems affected by some noise.
-
Question 4 of 15
4. Question
At the end of PBU 1, the downhole valve was opened up to prepare for the low flow rate sampling period. The reservoir engineer and the gauge engineers were confirming the time when the bottom-hole samplers would fire when they noticed a small pressure fall in the bottom-hole pressure gauges below the samplers. After checking more carefully, they noted that the fluid gradient between the downhole samplers had also increased to around 1.47 psi/m. During the sampling flow period, this fluid gradient stayed the same. The reservoir engineer adjusted the bottom-hole sampler timings and only took two samples during the low rate sampling flow. She reprogrammed the remaining samplers to fire at the start of PBU 2.
Could you think of a reason why this gradient could have increased?
-
-
-
-
Correct
It looks like the fluid could be water from the gradient. It could be that the well was flowing some water and at shut-in, the water still in the string fell down onto the tester valve. Once the tester valve was opened, it would fall into the well. Flowing the well at very low rates, the oil can bubble through the water and not lift it so the continuous phase is water and that is what a sampler would capture.
Incorrect
-
Question 5 of 15
5. Question
The PBU data are shown in the log-log plot below:

Why do we see some differences in the PBU responses, in particular at early and middle times? (multiple choice)
-
-
-
-
Correct
ESD response shows a larger wellbore storage (surface shut-in) and a different derivative stabilization (issue with wellbore phase redistribution or rate uncertainty).
We can also note an increase in skin from PBU 1 to 2.
Incorrect
-
Question 6 of 15
6. Question
Is the measured GOR increase supported by the PBU data and other evidence?
-
-
-
-
Correct
The derivative shape with features 1 and 2 could suggest some issue with wellbore phase redistribution (increase in total compressibility) or a multiphase region around the well at lower effective permeability to oil. However, these features are very consistent and do not change over time despite a supposed increase in GOR. In fact, the increase in GOR is likely an issue with the orifice plate meter. The DP across the gauges doesn’t change and is consistent with MDT results.
Incorrect
-
Question 7 of 15
7. Question
PBU 1 and 2 tests are shown in the superposition plot below.

P* decreased from 4924.2 to 4904.7 psi between the two PBU tests. Could this decrease in pressure be interpreted as depletion?
-
-
Correct
We could also see from Deconvolution later on that pseudo steady state hasn’t been reached at the end of the test (the reservoir is still open).
Incorrect
-
Question 8 of 15
8. Question
An attempt was made to recover a reliable deconvolution response over 128 hours, with two possible options below.
a) Initial pressure Pi= 4,924.2 psi at gauge depth

b) Initial pressure Pi= 4,921.4 psi at gauge depth

Which Deconvolution and initial pressure would you select?
-
-
Correct
4921.4 psi- because the two deconvolution responses are consistent and from the notes, more build-up data are used from PBU 1.
Incorrect
-
Question 9 of 15
9. Question
What is the minimum connected oil volume at surface, proven by DST 2?
(hint: bbl =ft³ x 0.17811)
-
-
-
-
Correct
pore volume x 0.178 x (1-Sw) / Bo
Incorrect
-
Question 10 of 15
10. Question
The figure below compares the conventional and deconvolved derivatives:

Why are the conventional and deconvolved derivatives different at late times?
-
-
-
-
Correct
Incorrect
-
Question 11 of 15
11. Question
The reservoir engineer offshore suggested a problem with limited entry (limited perforations or partial penetration), identifying the derivative stabilization 1 as the radial flow regime across some limited height. If so, what would be the penetration ratio?
-
-
-
-
Correct
Incorrect
-
Question 12 of 15
12. Question
What other well and reservoir single-layer models could we investigate? (multiple choice)
-
-
-
-
Correct
The Deconvolved derivative shape could be indicative of some heterogeneities and/or boundaries.
1: radial flow, 2: increase in mobility/storativity, 3: boundaries or decrease in mobility/storativity.
Incorrect
-
Question 13 of 15
13. Question
If we assume that a reservoir crossflow is visible in the derivative plot and that both layers have similar permeability-thickness KH, could you comment on the skin distribution across the perforations? What could the derivative stabilizations 1, 2 and 3 represent? Could we extract the permeability in layers U1 and U2?
-
-
-
-
Correct
Non-uniform skin distribution (in this case, high skin in one layer).
1: false stabilization due to the non-uniform skin distribution or radial flow in the low skin layer
2: radial flow regime for the total system
3: false stabilization due to distortion.
2 K1H1 = 5506.8 mD.ft -> K1= 50.1mD and K2= 76.5mD
Incorrect
-
Question 14 of 15
14. Question
From the distributed temperature array, we might conclude that 90% of the production comes from the top layer U1. If we assume an uniform skin distribution across the perforated intervals, what could the derivative stabilizations 1, 2 and 3 represent? Could we extract the KH and permeability values in layers U1 and U2 in this case?
-
-
-
-
Correct
Incorrect
-
Question 15 of 15
15. Question
In hindsight, how could we have reduced the flaring and shut-in duration? How many hours could we have approximately saved? (multiple choice)
(Hint: we can extract the minimum connected oil volume at surface with the following equation:

with Vmin: the minimum connected oil volume at surface in barrels, Sw: the water saturation, q: the oil rate in STB/D, Ct: the total compressibility in 1/psi, ∆t and ∆p’ the elapsed time in hours and derivative value in psi at the start of the pseudo-steady state).
-
-
-
-
-
Correct
We could have reduced flaring with a better test design (using the trial modern techniques) and ensuring that the pressure change is larger than the gauge resolution/noise. We could have used a real-time deconvolution for the shut-in duration.
qdt/dp’ = 2837.6 stb.hr/psi -> dt ~50hrs. We could have saved 128-50= 78 hours or about 3 days.
Incorrect
Quiz-summary
0 of 15 questions completed
Questions:
- 1
- 2
- 3
- 4
- 5
- 6
- 7
- 8
- 9
- 10
- 11
- 12
- 13
- 14
- 15
Information
get ready
You have already completed the quiz before. Hence you can not start it again.
Quiz is loading...
You must sign in or sign up to start the quiz.
You have to finish following quiz, to start this quiz:
Results
Time has elapsed
You have reached 0 of 0 points, (0)
Categories
- Not categorized 0%
- 1
- 2
- 3
- 4
- 5
- 6
- 7
- 8
- 9
- 10
- 11
- 12
- 13
- 14
- 15
- Answered
- Review
-
Question 1 of 15
1. Question
Why did the team install multiple gauges in the tubing? (multiple choice)
Correct
P* = Pi with an infinite acting reservoir. In this case, the late-time increase in the derivative suggests the presence of a boundary.
Incorrect
P* = Pi with an infinite acting reservoir. In this case, the late-time increase in the derivative suggests the presence of a boundary.
-
Question 2 of 15
2. Question
Could we extract some information about the fluid density between the gauges?
Correct
Incorrect
-
Question 3 of 15
3. Question
Which gauge would you select for well test analysis?
Correct
Incorrect
2808 seems affected by some noise.
-
Question 4 of 15
4. Question
At the end of PBU 1, the downhole valve was opened up to prepare for the low flow rate sampling period. The reservoir engineer and the gauge engineers were confirming the time when the bottom-hole samplers would fire when they noticed a small pressure fall in the bottom-hole pressure gauges below the samplers. After checking more carefully, they noted that the fluid gradient between the downhole samplers had also increased to around 1.47 psi/m. During the sampling flow period, this fluid gradient stayed the same. The reservoir engineer adjusted the bottom-hole sampler timings and only took two samples during the low rate sampling flow. She reprogrammed the remaining samplers to fire at the start of PBU 2.
Could you think of a reason why this gradient could have increased?
Correct
It looks like the fluid could be water from the gradient. It could be that the well was flowing some water and at shut-in, the water still in the string fell down onto the tester valve. Once the tester valve was opened, it would fall into the well. Flowing the well at very low rates, the oil can bubble through the water and not lift it so the continuous phase is water and that is what a sampler would capture.
Incorrect
-
Question 5 of 15
5. Question
The PBU data are shown in the log-log plot below:

Why do we see some differences in the PBU responses, in particular at early and middle times? (multiple choice)
Correct
ESD response shows a larger wellbore storage (surface shut-in) and a different derivative stabilization (issue with wellbore phase redistribution or rate uncertainty).
We can also note an increase in skin from PBU 1 to 2.Incorrect
-
Question 6 of 15
6. Question
Is the measured GOR increase supported by the PBU data and other evidence?
Correct
The derivative shape with features 1 and 2 could suggest some issue with wellbore phase redistribution (increase in total compressibility) or a multiphase region around the well at lower effective permeability to oil. However, these features are very consistent and do not change over time despite a supposed increase in GOR. In fact, the increase in GOR is likely an issue with the orifice plate meter. The DP across the gauges doesn’t change and is consistent with MDT results.
Incorrect
-
Question 7 of 15
7. Question
PBU 1 and 2 tests are shown in the superposition plot below.

P* decreased from 4924.2 to 4904.7 psi between the two PBU tests. Could this decrease in pressure be interpreted as depletion?
Correct
We could also see from Deconvolution later on that pseudo steady state hasn’t been reached at the end of the test (the reservoir is still open).
Incorrect
-
Question 8 of 15
8. Question
An attempt was made to recover a reliable deconvolution response over 128 hours, with two possible options below.
a) Initial pressure Pi= 4,924.2 psi at gauge depth

b) Initial pressure Pi= 4,921.4 psi at gauge depth

Which Deconvolution and initial pressure would you select?
Correct
4921.4 psi- because the two deconvolution responses are consistent and from the notes, more build-up data are used from PBU 1.
Incorrect
-
Question 9 of 15
9. Question
What is the minimum connected oil volume at surface, proven by DST 2?
(hint: bbl =ft³ x 0.17811)Correct
pore volume x 0.178 x (1-Sw) / Bo
Incorrect
-
Question 10 of 15
10. Question
The figure below compares the conventional and deconvolved derivatives:

Why are the conventional and deconvolved derivatives different at late times?
Correct
Incorrect
-
Question 11 of 15
11. Question
The reservoir engineer offshore suggested a problem with limited entry (limited perforations or partial penetration), identifying the derivative stabilization 1 as the radial flow regime across some limited height. If so, what would be the penetration ratio?
Correct
Incorrect
-
Question 12 of 15
12. Question
What other well and reservoir single-layer models could we investigate? (multiple choice)
Correct
The Deconvolved derivative shape could be indicative of some heterogeneities and/or boundaries.
1: radial flow, 2: increase in mobility/storativity, 3: boundaries or decrease in mobility/storativity.Incorrect
-
Question 13 of 15
13. Question
If we assume that a reservoir crossflow is visible in the derivative plot and that both layers have similar permeability-thickness KH, could you comment on the skin distribution across the perforations? What could the derivative stabilizations 1, 2 and 3 represent? Could we extract the permeability in layers U1 and U2?
Correct
Non-uniform skin distribution (in this case, high skin in one layer).
1: false stabilization due to the non-uniform skin distribution or radial flow in the low skin layer
2: radial flow regime for the total system
3: false stabilization due to distortion.
2 K1H1 = 5506.8 mD.ft -> K1= 50.1mD and K2= 76.5mDIncorrect
-
Question 14 of 15
14. Question
From the distributed temperature array, we might conclude that 90% of the production comes from the top layer U1. If we assume an uniform skin distribution across the perforated intervals, what could the derivative stabilizations 1, 2 and 3 represent? Could we extract the KH and permeability values in layers U1 and U2 in this case?
Correct
Incorrect
-
Question 15 of 15
15. Question
In hindsight, how could we have reduced the flaring and shut-in duration? How many hours could we have approximately saved? (multiple choice)
(Hint: we can extract the minimum connected oil volume at surface with the following equation:

with Vmin: the minimum connected oil volume at surface in barrels, Sw: the water saturation, q: the oil rate in STB/D, Ct: the total compressibility in 1/psi, ∆t and ∆p’ the elapsed time in hours and derivative value in psi at the start of the pseudo-steady state).Correct
We could have reduced flaring with a better test design (using the trial modern techniques) and ensuring that the pressure change is larger than the gauge resolution/noise. We could have used a real-time deconvolution for the shut-in duration.
qdt/dp’ = 2837.6 stb.hr/psi -> dt ~50hrs. We could have saved 128-50= 78 hours or about 3 days.Incorrect

