Detect a fluid breakout
A derivative plot can be used to identify the flow regimes and in particular the radial flow regime. The evolution of the derivative shape by overlaying the data from different PBU tests on the same log-log plot (called derivative overlay) will help to identify these flow regimes and to notice any changing flowing conditions in the near wellbore region.
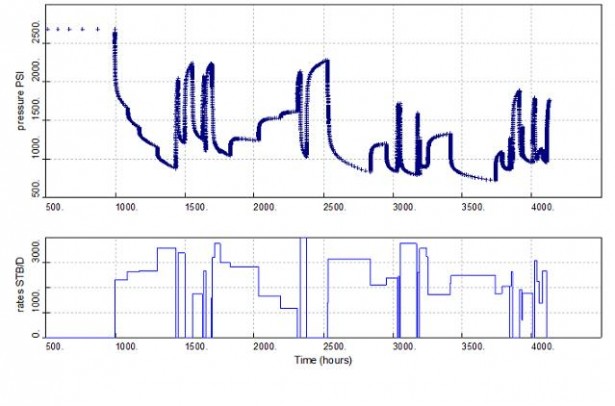
The plot below shows the downhole gauge pressure and rate data versus time for a (fictitious) oil well.
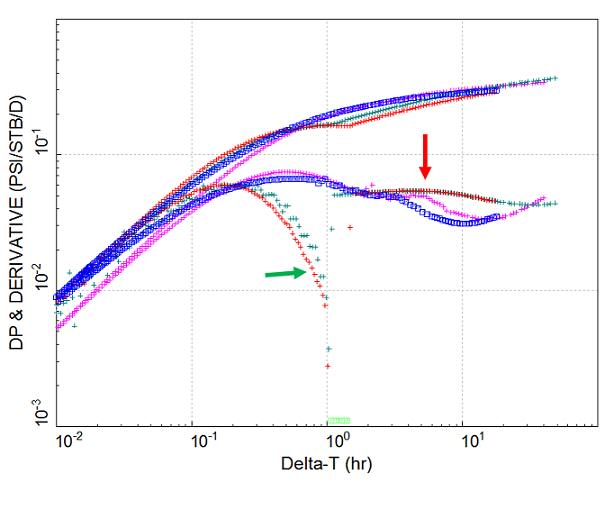
If we plot the pressure data from the different PBU tests on the log-log plot, the derivative overlay below is obtained:
As shown by the red arrow above, a small derivative stabilization is visible at early times, i.e. near wellbore, around 2 hrs. As we plot data from more recent PBUs, this early time “plateau” is extending towards later times, i.e. away from the well.
The derivative overlay shows a dynamic change, a region near wellbore at lower mobility is gradually extending and moving away from the well. In this case, this is consistent with a gas breakout: as the wellbore pressure is probably below bubble point pressure, a zone at lower effective permeability to oil is being created and gradually extending further away from the well (the well is not choked back during this period).
During this observation, no change was detectable at surface because, early on, gas saturation was still lower than critical value and because of uncertainty on rate measurement. Unfortunately, as the well wasn’t choked back, this was later confirmed at surface, and the situation became irreversible.
Pressure transient analysis will help you to detect and diagnose production problems, and to act before the situation becomes irreversible.

Also note in this example the derivative V-shape and discontinuity at 1hr which is visible in the late PBU tests (shown with the green arrow on the derivative plot). This is indicative of phase redistribution in the reservoir as the gas concentration increases in the wellbore.
In general, a fluid breakout would be first noticed with an increase in mechanical skin as the fluid breaks out at the perforation level. Then later on, the derivative would show the presence of a multiphase region around the wellbore (higher stabilization level at early times indicative of an inner region at lower effective permeability). After some time, total compressibility would also be affected, which would also impact the derivative and the data-plot.
The derivative overlay helps to understand other causes of performance deviation, monitor damage, detect water front and predict water breakthrough, quality control the rate data, etc…
For more information or for a discussion, please don’t hesitate to contact us.
Quicklook review
Simply send us your presentation or report via the
Secure File Transfer.
We will send you our comments, explain what could be missing, improved or better explained, and what other solutions are possible.
For a more detailed analysis, please send us more data. Check out the Input Needed.
Get the most out of your data !
Why testing wells ?
Exploration, appraisal, development
- Confirmation of discovery and productivity
- Clean-up and rate measurement
- Large volume fluid sample
- Well and reservoir performance
- (skin, KH, Pi, heterogeneity, boundaries)
- Reservoir connectivity & proven volume
- Flow behaviour around wellbore
- Large scale of investigation (100-1000s ft)
Production and injection
- Use of opportunistic shut-ins
- Track permeability, skin, reservoir pressure
- Monitor performance over time
- Understand performance deviation
- Assess well intervention
- Quality control rate measurement
No alternative
No other alternative to:
-
obtain large fluid sample
-
evaluate permeability over large distances (~100s-1000s feet),
-
assess well damage (skin)
-
investigate connectivity over large volume
Why using our services?
Global Experience from Explo to Production
Extensive experience from Exploration to Production in all types of wells and reservoirs worldwide.
Expertise in deconvolution
We have expertise in deconvolution.
Deconvolution is a great asset for your team. It helps to improve the understanding of the pressure data, refine initial pressure and add reservoir insights. While deconvolution is not new, it is often misused in the industry.
We are also dedicated to coaching you with deconvolution.
Dedicated to you !
We can act as your team well test expert, provide a 2nd review or simply reduce your expert’s workload.
We can review data from your shut-in or active wells with or without downhole gauges.
Maximum value
With costly and rare shut-in pressure data, don’t compromise on its interpretation.
We guarantee to provide more value out of your data. Let’s try a quick review of your existing design or interpretation and we’ll send you our comments.
Get a 2nd opinion
You already have a design or interpretation study but are not entirely satisfied or simply want to check if more value can be obtained at minimum cost?
Get a second review from us.
Our clients
We support geologists, petrophysicists, engineers from national companies, independents, majors and more “generalist” service companies.


