Constant Pressure Boundary
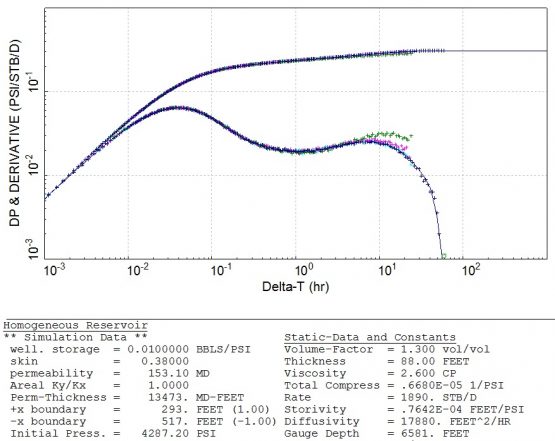
The constant pressure boundary is sometimes used to match a late-time drop in the derivative data, as shown below.
In the following well test interpretation, a constant pressure boundary was placed at 517 feet from the well.
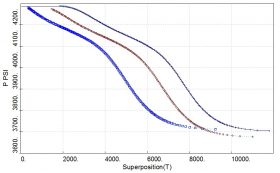
By definition, the pressure at this boundary is a constant equal to the initial pressure. As a result, the simulated PBU data stabilizes to this constant pressure and the derivative falls to 0, creating a drop in the log-log plot.
Now Obsolete !
There is no physical mechanism that would explain a static boundary remaining at initial reservoir pressure. The use of this immobile boundary is not plausible.
The constant pressure boundary is in fact an old solution that was developed using the obsolete method of images. This solution should no longer be used, but replaced by the linear composite model and a linear interface.
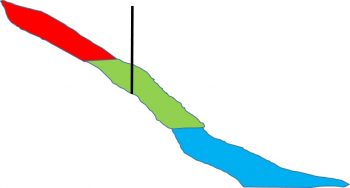
As presented in the schematic below, the oil reservoir is overlaid by a gas cap on one side and attached to an aquifer on the other side.
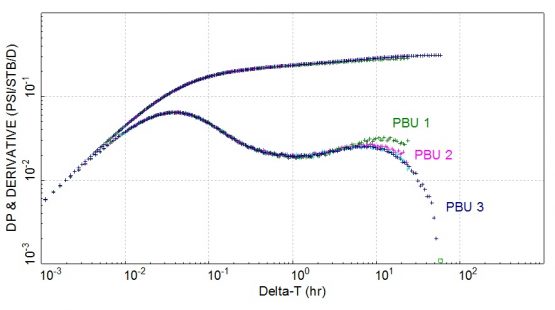
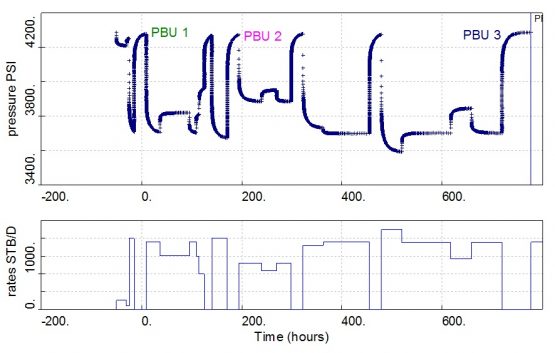
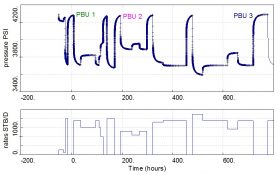
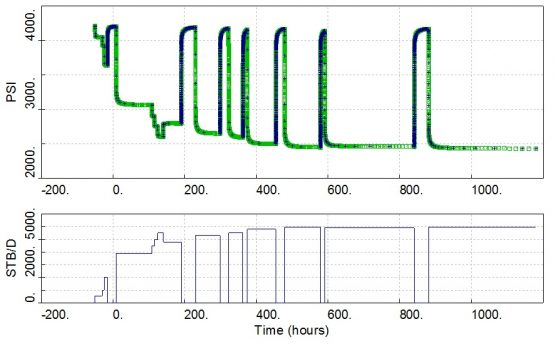
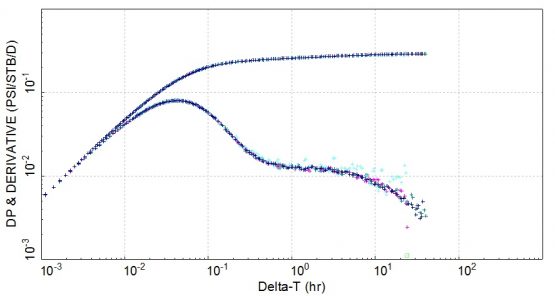
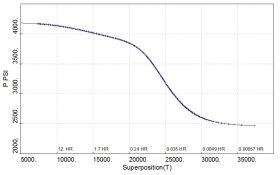
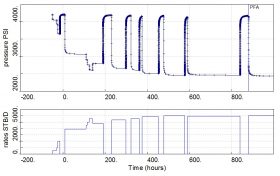
Several PBUs are shown in the derivative plot below.
After some wellbore storage and skin, a derivative stabilization is visible between 1 and 5 hours into the PBU test. The derivative then decreases and rapidly drops over the reminder of the pressure build-up.
A rapid fall of the derivative at late times could usually be explained by a closed reservoir (compartmentalization) or the presence of fluid contact. Based on Deconvolution and on our subsurface understanding, the effect of the gas cap was considered.
Due to the significantly higher gas compressibility and therefore mobility, the transition from an oil reservoir to a gas cap is indicated by a rapid decrease in the derivative. This feature dominates the pressure response and can sometimes mask other behaviour or characteristics.
The total system compressibility is defined as follows:
With Cr: the rock compressibility, Si: the saturation of fluid i and Ci: the compressibility of fluid i.
With the compressibility and saturation values in the table above, this formula gives the oil zone total compressibility of 6.7e-6 1/psi. A similar estimate of compressibility in the water zone gives 5.0e-6 1/psi and the water zone to oil zone storativity ratio is estimated as 0.75.
The gas compressibility can be estimated as the inverse of reservoir pressure 1/p = 1/4209psi = 238e-6 1/psi. This results in a total compressibility in the gas cap of 192.7e-6 1/psi. The gas cap to oil zone storativity ratio is then 28.8.
The water to oil zone mobility ratio can be estimated as the ratio of oil and water viscosities, i.e. 5.2. If we assume a gas viscosity of 0.02 cp, the gas to oil mobility ratio is estimated at 130.
These estimates will help reduce the non-uniqueness and understand the behaviour created by the gas cap and aquifer.
We then define a linear composite model with 3 reservoir regions to represent the oil zone, the gas cap and the aquifer.
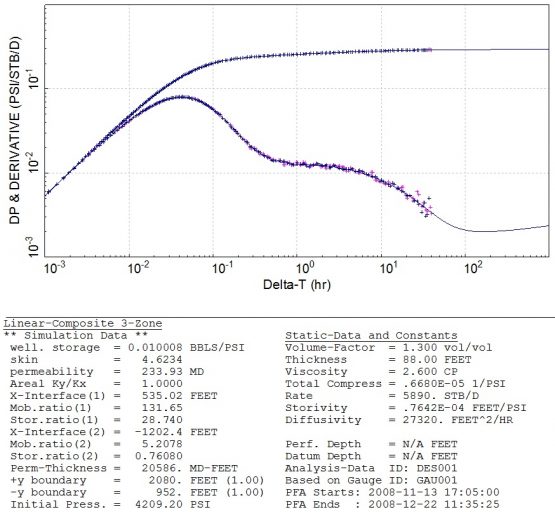
We can match the pressure buildup data by adjusting the permeability and the location of the fluid interfaces. Then we can slightly tweak the mobility and storativity ratios to improve the match. The results are shown below.
The reservoir permeability is 234mD and the total skin S= +4.6, with boundaries at 950 ft and 2,080 ft from the well. The well pressure behaviour is mostly controlled by the gas cap at about 530 ft and the aquifer at 1,200 ft away.



Thank you for your interesting article on the misuse of constant pressure boundaries in well test interpretation. The example you provided shows very interesting late time derivative behaviour which you would not have been seen if a constant pressure boundary model was selected but is not captured during the DST due to the well being shutin too early. Does this imply that the actual flow period wasn’t long enough or would the late time derivative been seen if the build-up was allowed to continue for a longer time? As a young reservoir engineer I was led to believe that you did not get any extra information by allowing for a buildup that was longer than the flow period -is this an outdated idea in light of what we see in your particular example where late time behaviour could be observed by extending the buildup time? Lets suppose this was a gas reservoir with an aquifer instead of an oil reservoir with a gascap and aquifer -would a linear composite model with an aquifer look the same as the derivative of a constant pressure boundary model if an aquifer was present and how would you determine if you had a linear composite model or a constant pressure boundary model as they would both show very similar derivative behaviour?
Hi Kanubhana,
Thanks for your comment, this is a good point. It is challenging to extend a shut-in for a production well and in general the big majority of the production PBUs are opportunistic, thanks to permanent downhole gauges. You could use a TAR or a long maintenance shutdown to see a bit further, but provided a good ops procedure. In this particular case, we think it has little value to increase the shut-in period, it would not drastically reduce the uncertainty. This late-time derivative shape could have been matched by using a constant pressure boundary (someone tried!), but this brings little information and as we said, is now obsolete.
Please note that this is not a DST- if it were, you still would not have to increase the shut-in duration, thanks to Deconvolution. This is also valid for interference or closed reservoir, you do not need to see the entire derivative fall, which could take a lot of time, and… money.)
Also note that PBU duration should be based on a well test design study and should not be too restricted because of the flow period duration, this is less of an issue now with modern analysis techniques.
If you had a gas reservoir, an aquifer would be spot as an increase in the derivative (water mobility << gas mobility), you should use the linear composite model, with a reduction in mobility and storativity at late times. We hope this helps! All the best, The TestWells team
Hi another curiosity here, do we only see the effect of the contacts in case the well perforation has some angle respect to the bedding plane?.
For instance if I have a verticall well in a horizontal bedding I think I may see the contact just in case of depletion but nor during my transient time since I will have just onestabilization.
On the other hand,If I have a well inclinated 45 degrees in a horizontal bedding I may see contact, the same could happen in your example where you shown that the well is vertical but the bedding plane has certain angle, where you may see two stabilizations, similar to the horizontal well.Then ,horizontal well in a horizontal bedding may be the best candidate to see contacts, Thanks for your feedback.
Hi Jhonatan,
Thanks for your comment. If the well is vertical, you would still see a fluid contact, as a linear composite behaviour. We do not think that the best candidate to see a fluid contact is the horizontal well. In some cases, you may spot the fluid contact during the vertical flow regime and that would make the analysis more complex and highly non-unique. That said, the horizontal well will be the best candidate to minimize coning.
We hope this helps.
Best Regards,
The TestWells team
Hi, Author
Recently we have carriedout Well testing in gas reservoir, in PTA after the radial flow there is an increase in derivative follwed by a sharp decrease in derivative and at the same time DP is stabilised. Since you said an increase in derivative if an aquifer would spot, but as per theory if any aquifer support in the well,the DP is constant and derivative tends to zero. kindly throw some light on this.
Hi Kkanala,
As the gas viscosity is very low compared to the water viscosity, you will see a change from a high mobile region (gas) to a low mobile region (water), therefore an increase in derivative.
The DP could become constant because of different reasons such as an increase in fluid density below the gauge or interference.
Best Regards,
The TestWells team
Hi Team,
In Kapa Saphir, do we know also same result as figure above? what is Li, M and D at the Saphir, is it correlate with mobility ration and storativity?
Thank you
regards
Hi Adhinaharindra,
In Saphir, we have the linear composite model (but only for 2 zones and we cannot add any boundary). So unfortunately we cannot replicate this last model with Saphir (using analytical solution). Li is the distance to the linear interface, M is the mobility ratio, and D is the diffusivity ratio (a bit more complicated ratio to use, compared with the storativity ratio).
Best Regards,
The TestWells team
H,
Does the generated Model “a linear composite model with 3 reservoir regions to represent the oil zone, the gas cap and the aquifer” can be done using Saphir?
Thanks
Hi Saber,
Thanks for your comment. This analytical model is not available in Saphir, but in some other softwares like PIE. One way to do it in Saphir would be to create a complex numerical model.
We hope this helps.
Best Regards,
The TestWells team