Reservoir Heterogeneities
Some heterogeneities in the reservoir are represented by some changes in fluid and reservoir properties further away from the well. These can be characterized with two types of behaviour:
-
Radial composite reservoir
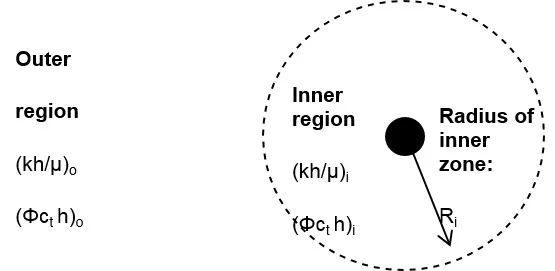
In this case, the reservoir is divided into 2 (or more) circular regions with different mobility (kh/µ) and/or storativity (Φ Ct h) values.
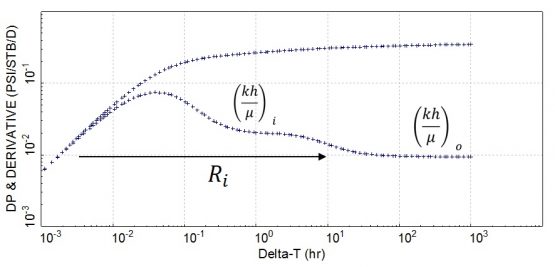
The derivative plot will show two distinct stabilizations due to the two reservoir regions.
Following the derivative unit-slope straight line and hump (due to wellbore storage and skin), there is an early derivative stabilization which defines radial flow regime in the inner region of the reservoir. Then a late derivative stabilization is indicative of radial flow regime in the outer region. This particular example assumes an increase in mobility further away from the well.
-
Linear composite reservoir
In this case, the reservoir is divided into 2 or more regions with different mobility (kh/µ) and/or storativity (Φ Ct h) values, separated by a linear interface.
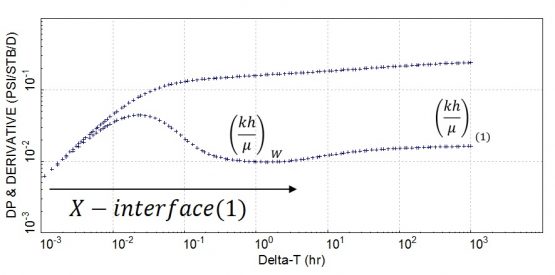
The derivative plot will show two stabilizations due to the two reservoir regions.
This particular example assumes a reduction in mobility further away from the well. After the wellbore storage effects, the first derivative stabilization at 1hr defines radial flow regime in the reservoir region where the well is located.
The second derivative stabilization at late times develops when the linear interface is reached and both reservoir regions are producing towards the well. The resulted behaviour defines the average properties of the two regions.
The radial composite model is NOT recommended for reservoir characterization in Exploration and Appraisal.
The radial composite model shouldn’t be used to characterize the reservoir in exploration and appraisal (unless acidification or multiphase in the reservoir). The radial composite model defines two circular regions around the well of different mobility (KH/μ) and/or storativity (ΦCth) values. It is not recommended to use this model in Exploration and Appraisal well testing because it is generally not compatible with the geology.
What are the odds for the geology to be equivalent to circular regions of different properties and then to drill a well in the exact centre of the concentric circles…?
The radial composite model should be best applied to represent changing flowing conditions around the well, created by the operations. These include:
• Fluid bank around the well (gas breakout, liquid drop-out in the reservoir), due to production below bubble point pressure or dew point pressure,
• Injection flooded zone and cold water zone (water/gas injection),
• Acidification (in a carbonate reservoir).
Linear composite model is best used to represent changes in rock properties, fractured and faulted reservoirs.
A linear composite model represents two or more regions of different mobility (kh/µ) and/or storativity (Φ Ct h) ratio, separated by a linear interface. This is best suited to represent changes in rock properties, fractured and faulted reservoirs, and as a result, this interpretation model is the most used.
Unfortunately some well test softwares, such as Saphir, have a lot of limitations with the linear composite model, and cannot model more than 2 zones with the presence of boundaries.
Examples
Vertical well in a channel reservoir
Let’s assume a vertical well in a channel reservoir but with an increase in net reservoir thickness further away from the well.
This is illustrated by the schematic below.
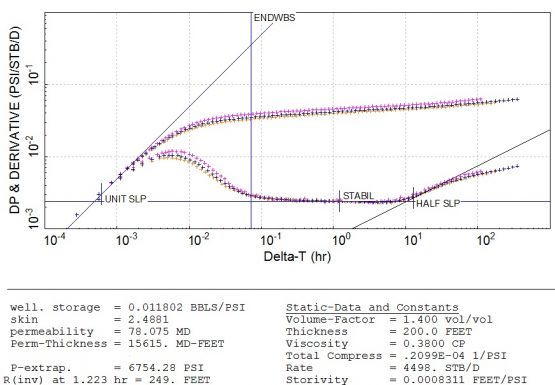
The pressure data from different shut-ins are shown on the derivative plot.
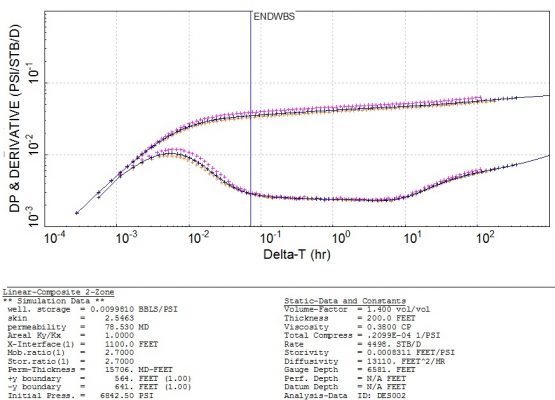
In this particular example, we first see the channel then the increase in thickness. The latter is represented by a linear composite behaviour with an increase in mobility (kh/µ) and storativity (ΦCth).
We assume that radial flow regime develops around the well, at about 0.4 hour. As a result, the permeability-thickness is equal to 15,615mD.ft (or permeability K=78.1mD for H=200ft) over a radius of 250 feet. The total skin is equal to St = +2.5.
The increase in derivative from 10 hours onwards would be explained by the presence of the channel near the well. At late times, the decrease in the derivative would be explained by the presence of the region at higher mobility and storativity (due to the increase in net reservoir thickness) further away from the well.
The figure below shows the well test analysis and calculated parameters using a vertical well model with wellbore storage and skin in a single-layer linear composite reservoir with the presence of boundaries.
A schematic of the above model is represented below:
Fractured well in a naturally fissured reservoir
The plot below shows the response of a well with a hydraulic fracture in a naturally fractured reservoir.
At early times, we can spot the fracture behaviour with a half-unit slope straight line, followed by a derivative stabilization indicative of radial flow regime (outside the fracture). At late times, the increase in derivative is due to a change in fracture density in the reservoir. There is a region with a lower fracture density, which could be equivalent to a linear composite behaviour, with the presence of a lower mobility region. In this topic, we strongly recommend reading SPE 24678.
Acidized well in a carbonate reservoir
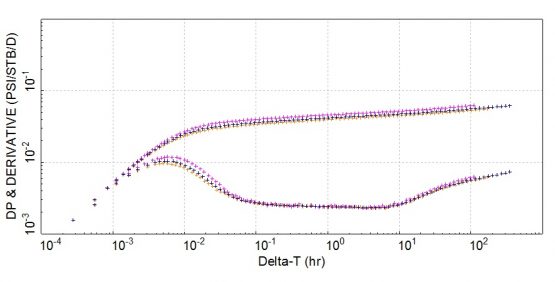
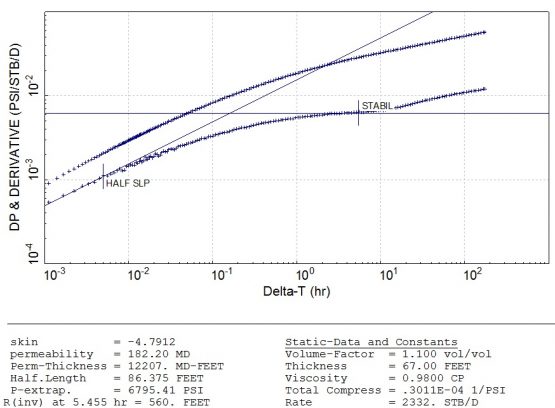
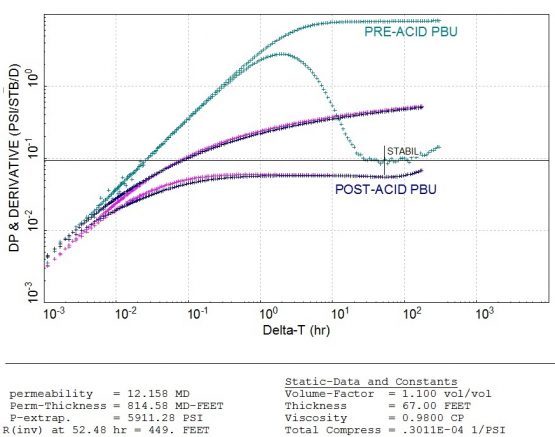
The figure below shows the post-acid PBU response on the conventional derivative plot.
Compared with the pre-acid response, the post-acid derivatives are consistent and shifted downwards, showing an improvement in well performance. There isn’t any sign of a derivative hump in the post-acid PBU tests so the well is no longer damaged.
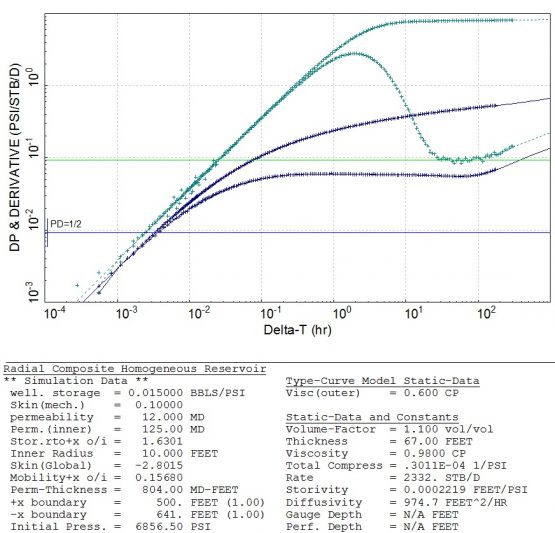
It is worth noticing that for an acidized well, the long derivative stabilization in the post-acid PBU may not be indicative of radial flow regime in the inner or outer zones. In this case, this is a “false” stabilization.
The post-acid derivative can be matched with a radial composite model with a very small radius, bringing the derivative down. In this example, the radial flow regime in the inner zone is represented by the blue horizontal line and that in the outer zone by the green horizontal line. Note that these lines do not coincide with the long derivative stabilization.
Production well producing below bubble point pressure
Production well G6z suffered some few shut-ins since start-up; these were later used to investigate the well and reservoir performance.
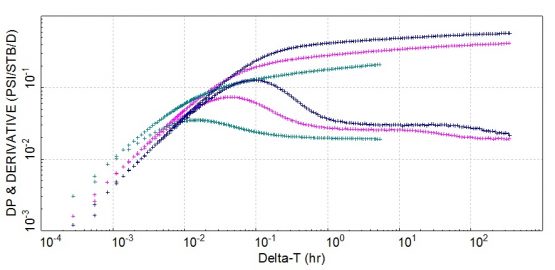
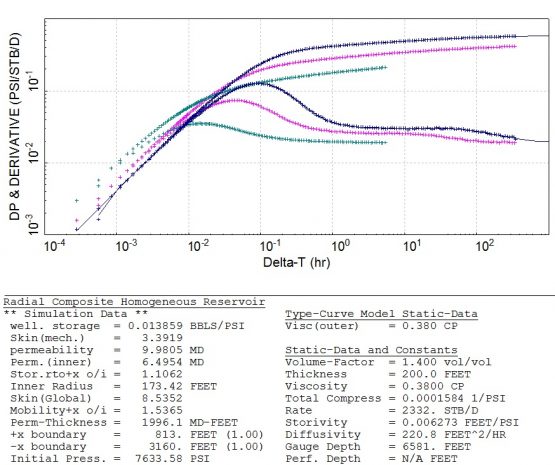
The well responses are shown in the log-log plot below.
The evolution of the derivative plots is not consistent with partial penetration effects but is an indication of some changing flow conditions near the wellbore. This is consistent with a gas breakout and as production continues, a multiphase region develops in the reservoir and extends further away from the well.
In this case, a radial composite model should be used. The inner zone represents the multiphase reservoir region with a slightly lower oil mobility caused by the increase in gas saturation near wellbore.
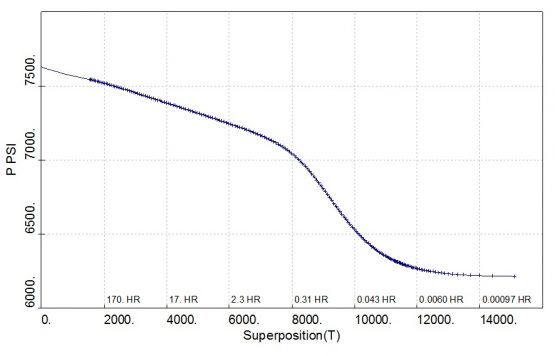
According to the interpretation below, the two-phase region extends 170 ft away from the well by the time of the third PBU test.
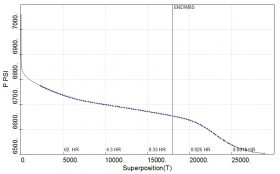
The superposition plot is shown below:
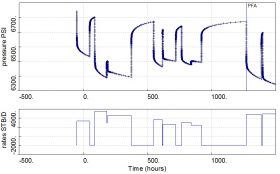
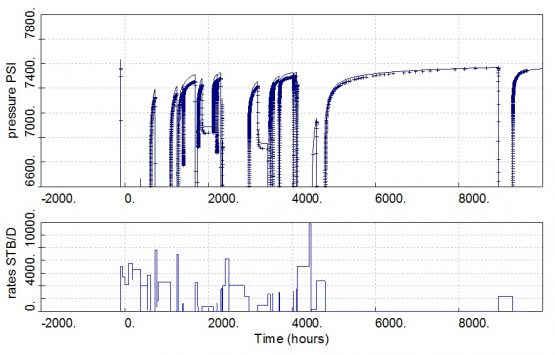
The long term pressure match using this model is shown in the figure below.
The model was tuned to match the last PBU, but it cannot be expected to match the entire long term pressure behaviour, as the multiphase region evolves with time, with some changes in gas saturation and compressibility.

