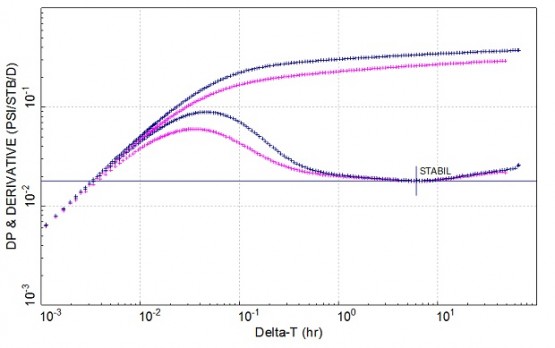
Note the y-axis is rate-normalized (“/STB/D”).
This derivative stabilization level is proportional to :
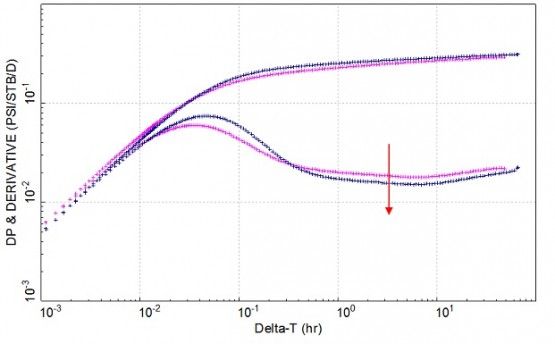
If the rate before the PBU is wrong or incorrectly estimated, the derivative will be shifted. Additional erroneous features may also be introduced.
The example below uses a rate that is over-estimated by 20 %.
The resulting permeability will then be over-estimated by 20% in this case.
This is why it is critical to perform routine production flow tests so as to reduce the uncertainty on the rate data. (By the way, these are sometimes called “well tests” to add some confusion…)
The impact of rate history on the derivative
To analyze a PBU test from a production shut-in, the derivative is defined by deriving the pressure with respect to the superposition time. This time function is shown below:
The superposition time takes the rate history into account. As a result, an error in the rate history may have some negative impact on the derivative.
Input some rate data…
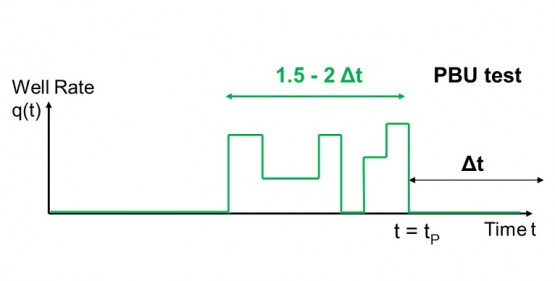
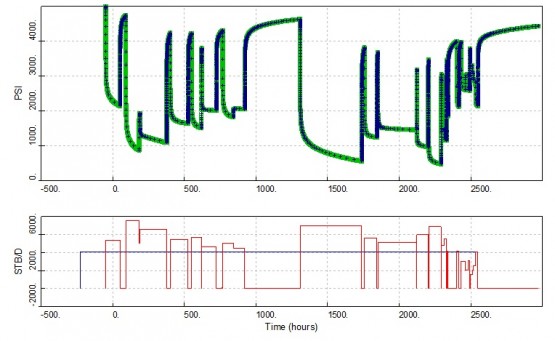
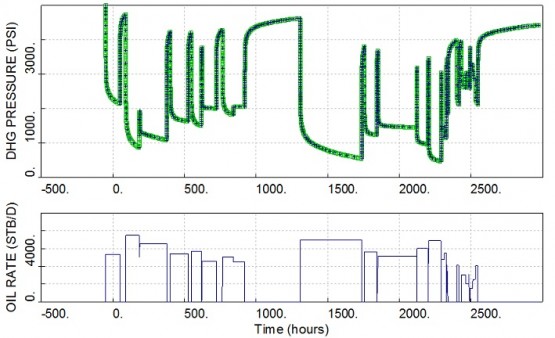
Once a production PBU or an injection PFO is detected, the pressure data are uploaded into the well testing software, along with some rate data. In general, the rate history gets truncated and simplified.
Some “rules of thumb” are sometimes being used, but these vary according to whom you ask… Some use a rate history of duration 1.5 or 2 times the shut-in duration.
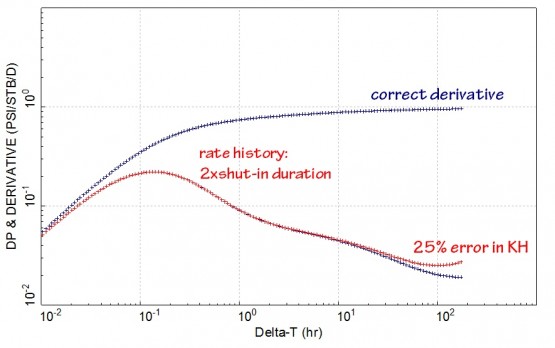
However, this is a rule of thumb, and as such, it doesn’t work all the time. It can introduce some erroneous features in the derivative and lead to some wrong results. An example is shown below.
In the above case, using a rate history of duration equal to 2 times the shut-in duration will result in a 25 % error in permeability KH. Since this is a vertical well with limited perforations, that mistake will impact the perforation height, vertical permeability, skin and the distances to the boundaries. All the calculated reservoir parameters will be wrong.
Truncating the rate history is likely to bring some errors, especially when under transient period. A pressure transient “disappears” once it reaches the boundary. As a result, the rate history should at least extend to a duration equal to the time to reach pseudo-steady state.



Thank you so much for an useful post.
Hi Huyvh, thanks for your comment!
Happy to see it is useful for you.
– The TestWells team
Is it possible for you to post Well Test Analysis on Fractured Horizontal Well?
Hi Huyvh,
Thanks for your comment and suggestion, this is much appreciated.
We will soon cover PTA for horizontal wells and for fractured vertical wells. Then we will plan to post PTA on frac horizontal wells sometime this year.
Thanks!
The TestWells team
Hi,
thank you so much!
may you tell me are you using from which software?
i am using from FAST-2015 and old version of pansys (4.3)
may you guide me about derivative plotting-my means is when we must plot Rate Normalized Pressure, when Pws, against real time or superposition time or equivalent time. because any time i change my axis, my derivative curve will change totally apart from the before one. my data are from a Full Bore DST and the rates are fixed during every flow periods. Delta Time(last)/Delta Time (next to the last) before 2nd PBU is less than to (=1.77). and there are three flow periods before 2nd PBU on three different choke Sizes
i’ll be thankful is you help me
Hi Artin,
Thanks for your comment. We are using PIE and Saphir. For the derivative, pressure should be derived with respect to the superposition time and plotted versus the shut-in duration. We do not recommend using the equivalent time.
We hope this helps.
Best Regards,
The TestWells team
less than two (=1.77)
Hi,
Thank you SO much for your quick answer.
Best Regards
Hi , We are dealing with PTA data which rate during well test ( before shut in) is highly uncertain and some times haven’t been measured.
But we have rate history ( monthly average) from OFM. I know its will definitely affect our results but wanted to have your advice about the level of error in results and also any possible solution to reduce uncertainties in results.
Regards,
Amir
Hi Amir,
Thanks for your comment.
You could do some sensitivity with the rate history and see the impact on the derivative and calculated parameters.
You should try to estimate the rate the best you can, and use the monthly average as a guide. Perhaps if you have some production flow tests here and there (also called “well tests” in operations), you could calibrate a well model (IPR and VLP) and estimate the rate for several time periods, using the pressure as input. Perhaps you could also use some choke model to have some estimation of the rate.
We would recommend to set a surveillance strategy to reduce this uncertainty and ensure the best quality data to protect the base production and optimize the new well delivery.
We hope this helps.
Best Regards,
The TestWells team
considering lower duration makes derivative to move upward with increasing upward slope….THAT’S CORRECT – AS YOU SAID.
But what about over-estimating rate history?
we can increase duration of rate history and it change from upward movement to downward… it is not every time like your “second video” !!!
It may be goes downward…
What should we do in this condition????
Hi Ali,
Thanks for your comment. We would recommend to use the entire rate history if you can.
Which software do you use? We are happy to have a look at this problem if you send us more info.
Best Regards,
The TestWells team