Nowadays, some companies not only tend to reduce the number of appraisal wells to a few in the best field locations, but they also give priority to MDT and mini-DST as the only fluid samples and dynamic data. These tools give some pieces of the reservoir puzzle, but they have a very small scale of investigation (couple of feet) and the data can be corrupted by the presence of drilling and completion fluids near wellbore. This could result in some misleading and limited information on PVT, productivity and connectivity.
Why we need an exploration and appraisal well test
An exploration and appraisal well test confirms an oil/gas reservoir discovery and well productivity as we flow the well for the first time. There is no alternative to assess the well damage, obtain reservoir information over a large scale of investigation (1000s metres), capture some large bottom-hole fluid samples, and obtain some information on connectivity over large volume. Other parameters such as initial pressure, reservoir heterogeneities, boundaries, restrictions to the flow behaviour can also be extracted.
Below is an example of well test results:
A permeability-thickness KH= 53,474 mD.ft with a radius of investigation Ri=1,050 feet. This results in a permeability of 396.1 mD given a net reservoir thickness of 135 feet.
The total skin is the same as the wellbore skin: S = + 9.2. The reservoir is not closed, with one sealing fault at 1,170 feet and the minimum connected volume is about 140.8 millions barrels of oil at surface.
Other possible reservoir configurations could match the data and these results can be integrated with other sources of subsurface information.
Performing a well test will help to appraise more of the reservoir with less number of wells and ultimately avoid a (bad) surprise during production stage.
This is in theory but in practice… a well test could lead to some failures…
Some insufficient and misleading exploration and appraisal dynamic data
Companies could spend millions of dollars in well testing operations to acquire exploration and appraisal dynamic flow data and plan a field development.
However, on some well tests, the pressure and rate data are of poor quality and do not even contain enough information. Uncertainty on the calculated well and reservoir parameters cannot be properly evaluated. Compartmentalization problems are not spot, leading to huge financial losses in production stage.
Some notorious failures in oil and gas production (plant not properly designed, rate not as forecasted, high decline, low recovery, etc.) could be related to some poor well test design, operations and analysis during the exploration and appraisal campaign.
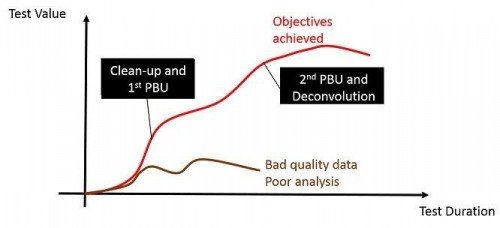
On the other hand, some other well tests are really too long, acquiring more than enough. In some cases, hundreds of hours with a rig could be saved, without compromising the data quality, the subsurface objectives or safety.
Well test data are the only dynamic data that a company will get to design the processing facilities and a development plan over 20+ years. We better need to get it right and obtain data that are representative of the well and reservoir.
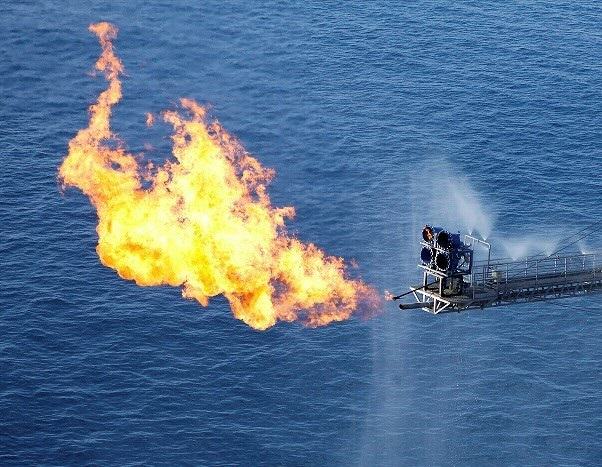
Cost could be minimized by saving rig time and hydrocarbon flaring could be reduced while safely acquiring the best quality subsurface data.
The right design for your exploration and appraisal well test
The right design starts with the subsurface objectives. Without clear objectives, we won’t have a clear design and operations. The only aim of a well test should be to ensure the best quality data to achieve the subsurface objectives in a safe and environmentally friendly way. Don’t take some shortcuts to save some percents on the budget, with the risk of compromising the data quality, the objectives and the safety of the operations.
Well test design study
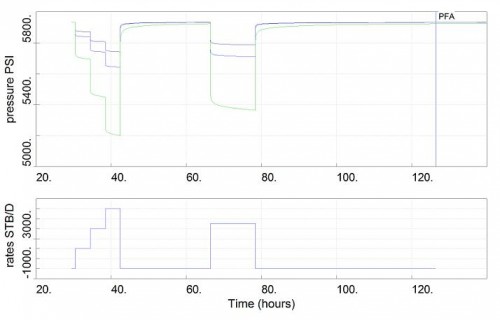
The design study should be an iterative rigorous process which ends up with a rate schedule that can achieve the subsurface objectives and capture extra value out of the test.
Multiple scenarios and “what if” cases should be investigated, working with a range of well and reservoir parameters to obtain a range of results.
By doing a design study, the reservoir engineer will be better prepared during the operations and will have a better understanding of the test.
Reduce flaring
Even if connected volume is an objective, we don’t need to make a “significant” dent in the reservoir by flaring a large hydrocarbon volume to observe a depletion DP. Thanks to high technology gauges with resolution of 0.01 psi, we can minimize the DP and flared volume. The use of the latest deconvolution technique can help to further reduce flaring.
Acquire the best quality data
Deep gauges
The pressure at the gauge needs to be a direct measurement of the pressure at the well perforations. In practice, during shut-ins, the fluid weight below the gauge may change over time, with heavy fluid falling down the well and gas migrating at the top. In these cases, PBUs might be entirely dominated by wellbore dynamic effects and won’t be representative of the well and reservoir.
The solution is to run some gauges as close as possible to the perforations. For exploration and appraisal, you should target less than 50 ft TVD. Yes, less than 50ft…
You can do this with wireless pressure gauges (Metrol or Schlumberger Muzic) and clamp those in the outside diameter (OD) of the string.
Multiple gauges
Multiple gauges along the tubing help to track fluid movements via changes in fluid density. This is not only good practice for redundancy (in high temperature wells, only 1 out of 12 gauges may survive), but it will help to improve the understanding of the wellbore dynamics during the well test and killing operations.
Downhole shut-in tool
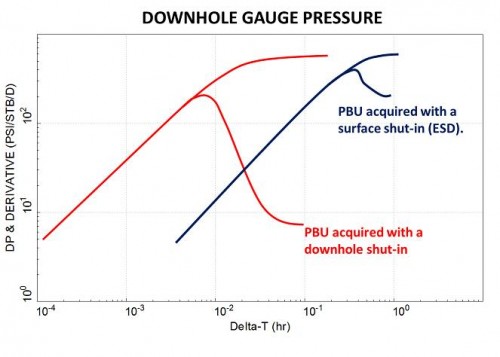
A downhole shut-in tool not only reduces the wellbore storage, but it also helps to minimize wellbore phase redistribution, noise and vibrations from surface.
On some well tests, a PBU from a surface shut-in may not even be reliable.
That cannot be ignored for exploration and appraisal.
Operations with real-time monitoring
During operations, real-time monitoring with multiple real-time gauges help to validate the data and optimize the test. We stay in control of the test, in particular during clean-up and killing operations, and we know what the fluids are in the tubing thanks to the different DP across the consecutive gauges.
Real-time deconvolution and analysis during operations will help to further reduce the shut-in duration, in some cases, up to few hundreds of hours.
Are all the interpretation plots matched ?
If you cannot see all the well testing plots in a post operations interpretation, whether you have a vertical, horizontal, frac wells: this is a RED FLAG. We should use all the well testing tools and plots: conventional and deconvolved derivatives, superposition and production history plots.
In well test analysis, you shouldn’t be too optimistic but also explore the possible downside cases. Exploration and appraisal stage is certainly the good time to spot and test the downside scenarios, before some huge investments.


Dear Sirs
Which properties can be obtained during the wellbore storage phase in log-log plot analysis?
regards
Hi Isactsamba,
Thanks for your comment.
The wellbore storage phase will give you the wellbore storage coefficient (fluid compressibility x volume).
You could use the wellbore storage phase to monitor for example the size of a fracture (in particular for water injectors with thermal fractures) or to monitor the fluid compressibility for example in production.
We hope this helps.
Best Regards,
The TestWells team